Why You Need To Measure apoB To Assess Your Cardiovascular Risk

The fundamental characteristic of atherosclerosis is when a cholesterol particle becomes trapped in the artery wall.
It is the inflammatory response to this particle retention that causes the formation of atherosclerosis1.
Think of it like a tennis ball passing through a net and getting stuck on the other side.

Many factors make the lipoprotein particle more likely to become retained in the artery wall, such as high blood pressure, insulin resistance and smoking.
But fundamentally, there must be a particle to cross the artery wall.
Think of the lipoprotein particle as the cause and the others as amplifiers2.
Theoretically, there could be no atherosclerosis if there were no atherogenic lipoprotein particles.
To understand this process, you must understand more about lipoprotein particles.
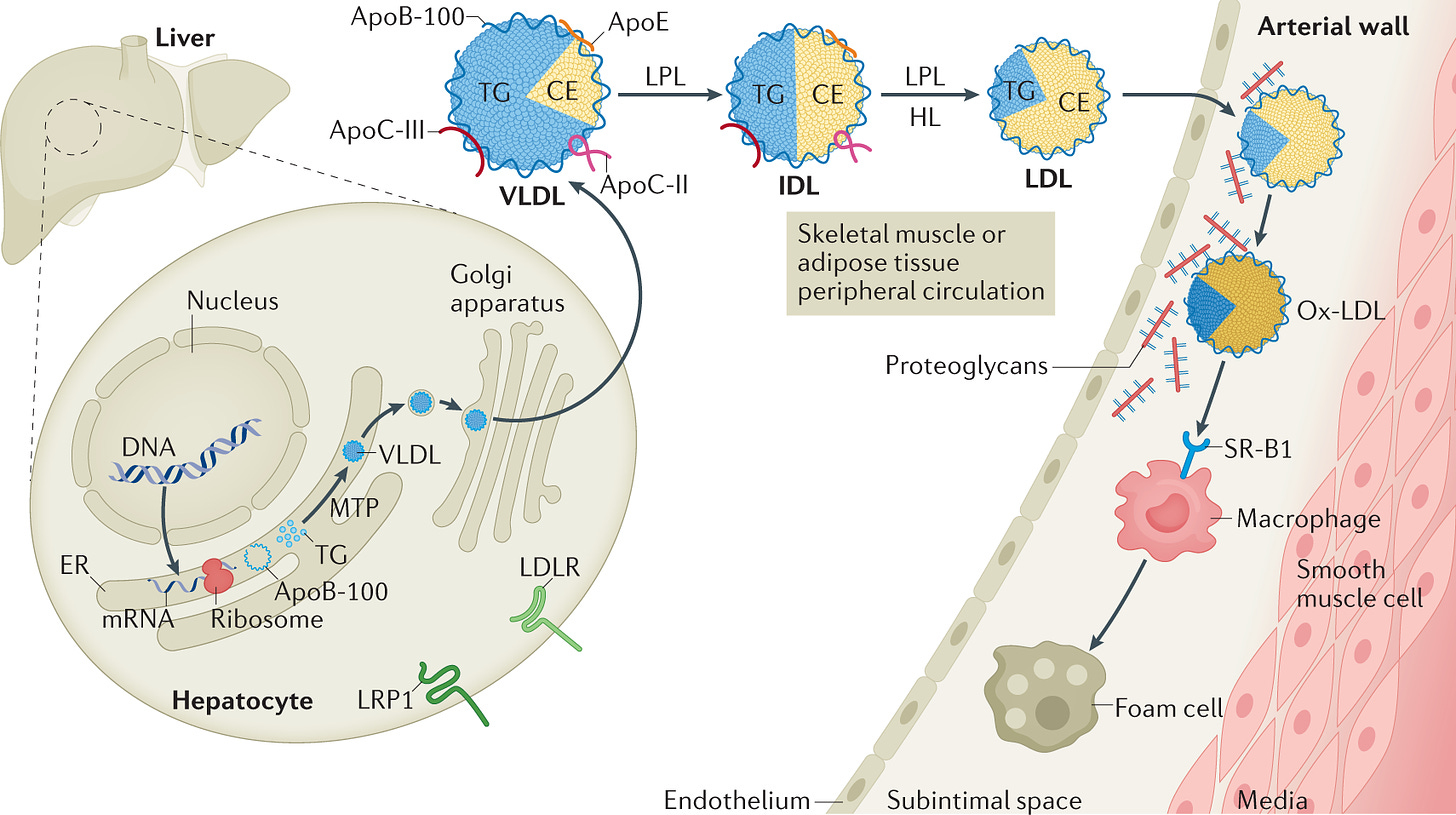
In general terms, lipoprotein particles are produced in the liver as VLDL particles. The VLDL particles become IDLs, then LDL particles, as is shown in the diagram above.
Each of these particles contains varying amounts of LDL cholesterol (CE) and triglycerides INSIDE the particle.
Each of the particles has ONE and ONLY ONE apoB protein on the outside of the particle.
apoB 48 particles are a discussion for another day.

The total number of apoB particles is one of the most significant determinants of the risk of atherosclerosis3.
More apoB particles.
The higher the chances of atherosclerosis.
But what about LDL cholesterol?
LDL cholesterol is a reasonably good proxy marker for the number of apoB particles.
But not always….
When LDL cholesterol is measured, it is typically done in the fasted state.
In this case, the only lipid particles remaining in circulation are usually LDL and Lp(a) particles. The remaining particles have been cleared.
When LDL cholesterol is measured, it measures the ‘contents’ of the apoB particle.
NOT…. the number of apoB particles.
It is the number of apoB particles that is the greatest determinant of risk. Not the LDL cholesterol concentrations4.
But why have we been measuring LDL cholesterol all of this time?
For two reasons.
-
Because historically, it was easier. But not any more.
-
It roughly equates to the number of apoB particles in insulin-sensitive individuals.
But I suspect it has not escaped your attention that most people are no longer insulin-sensitive.
Approximately 88% of the United States adult population have at least one marker of metabolic syndrome, therefore suggesting a degree of insulin resistance5.
LDL cholesterol, when measured in the context of diabetes, metabolic syndrome or insulin resistance, is not an accurate reflection of the number of apoB particles in circulation.
If it is no longer an accurate reflection, then it is no longer an accurate reflection of risk.
When evaluating a standard lipid panel, Non-HDL Cholesterol (Total - HDL Cholesterol) better approximates the number of apoB particles and why it is increasingly used over LDL cholesterol values6.
But we can easily and cheaply evaluate apoB particle concentration, so why use a proxy measure.
You can measure it directly.
Concordance & Discordance
When LDL cholesterol concentrations and apoB numbers roughly align in terms of their percentile levels, this is described as concordant.
i.e. the apoB particle concentration is at the 50th percentile for the population, and so is the LDL cholesterol value.
But as we have learned, this may not be the case in the setting of insulin resistance.
When there is discordance, the apoB values might be at a higher percentile than the LDL cholesterol values might suggest.
This leads to an underestimation of risk.
Additionally, LDL cholesterol is usually calculated and not directly measured, which introduces another set of potential inaccuracies in its measurement. This is particularly problematic when triglycerides are high or LDL-C is very low.
So why deal with a host of potential inaccuracies when you can just measure apoB directly?
The main reason is inertia.
Medicine is just slow to change.
We have known about apoB’s superior risk prediction for over 30 years.
And yet.
So let’s look at some examples.
Another way to evaluate apoB levels is to measure the number of LDL cholesterol particles. This is known as LDL-P. For now, all you need to know is that apoB ~ LDL-P, so we will use them interchangeably.
We know that High apoB (LDL-P) is likely to be a better predictor of risk.
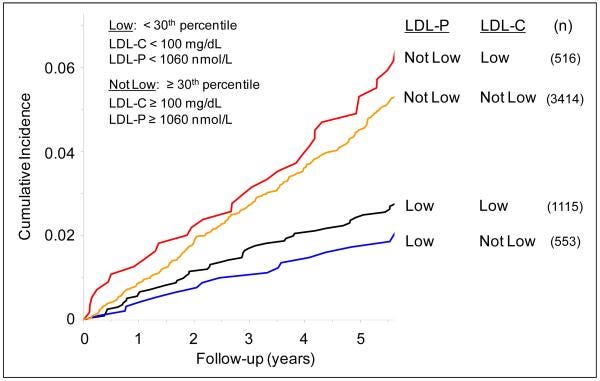
What happens when you compare groups who are concordant in their risk, i.e. apoB & LDL-C are high, to people who are discordant, i.e. apoB is high, but LDL-C is low?
You find that the risk of cardiovascular events tracks with the apoB and not the LDL cholesterol value7.

The main takeaway is that the NUMBER of LDL particles (apoB) best determines risk, not the LDL-Cholesterol value.
But equally importantly, just because you have a normal LDL-Cholesterol does not mean you are not at risk.
What do apoB levels look like?
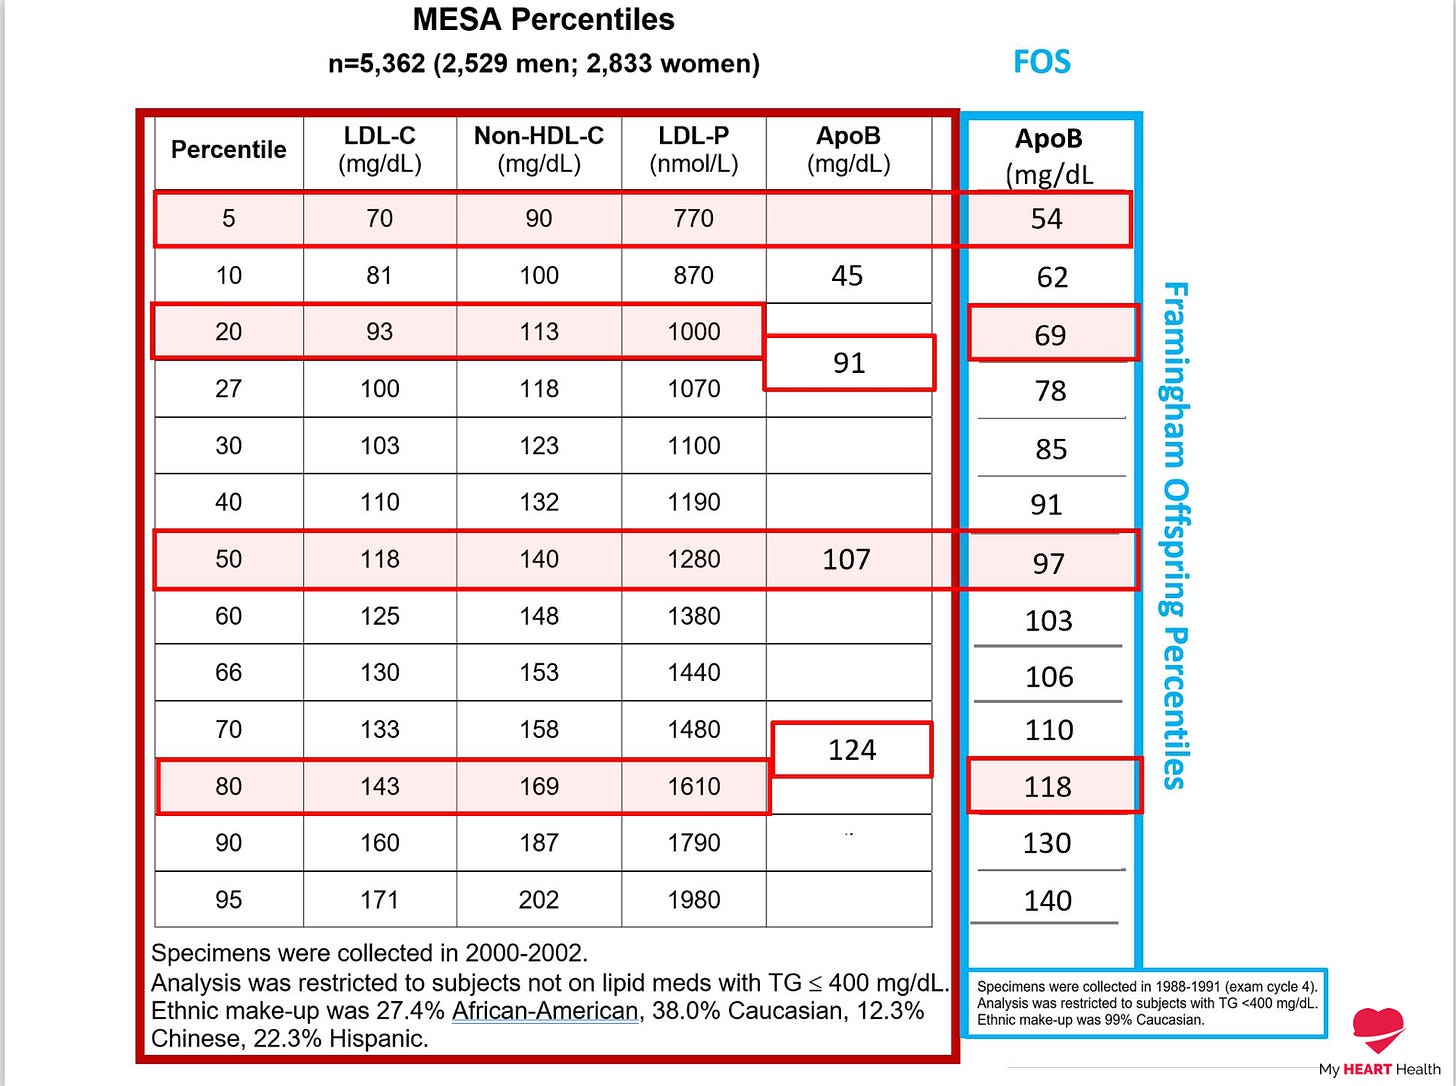
First, let's evaluate them on a percentile basis against the standard lipid metrics of LDL cholesterol etc.

Depending on the cohort used, you can see that an apoB at less than the 5th percentile, which is where risk is typically lowest, corresponds to an apoB of <60 mg/dl. This corresponds to an LDL cholesterol value of 70 mg/dl or 1.8 mmol/l.
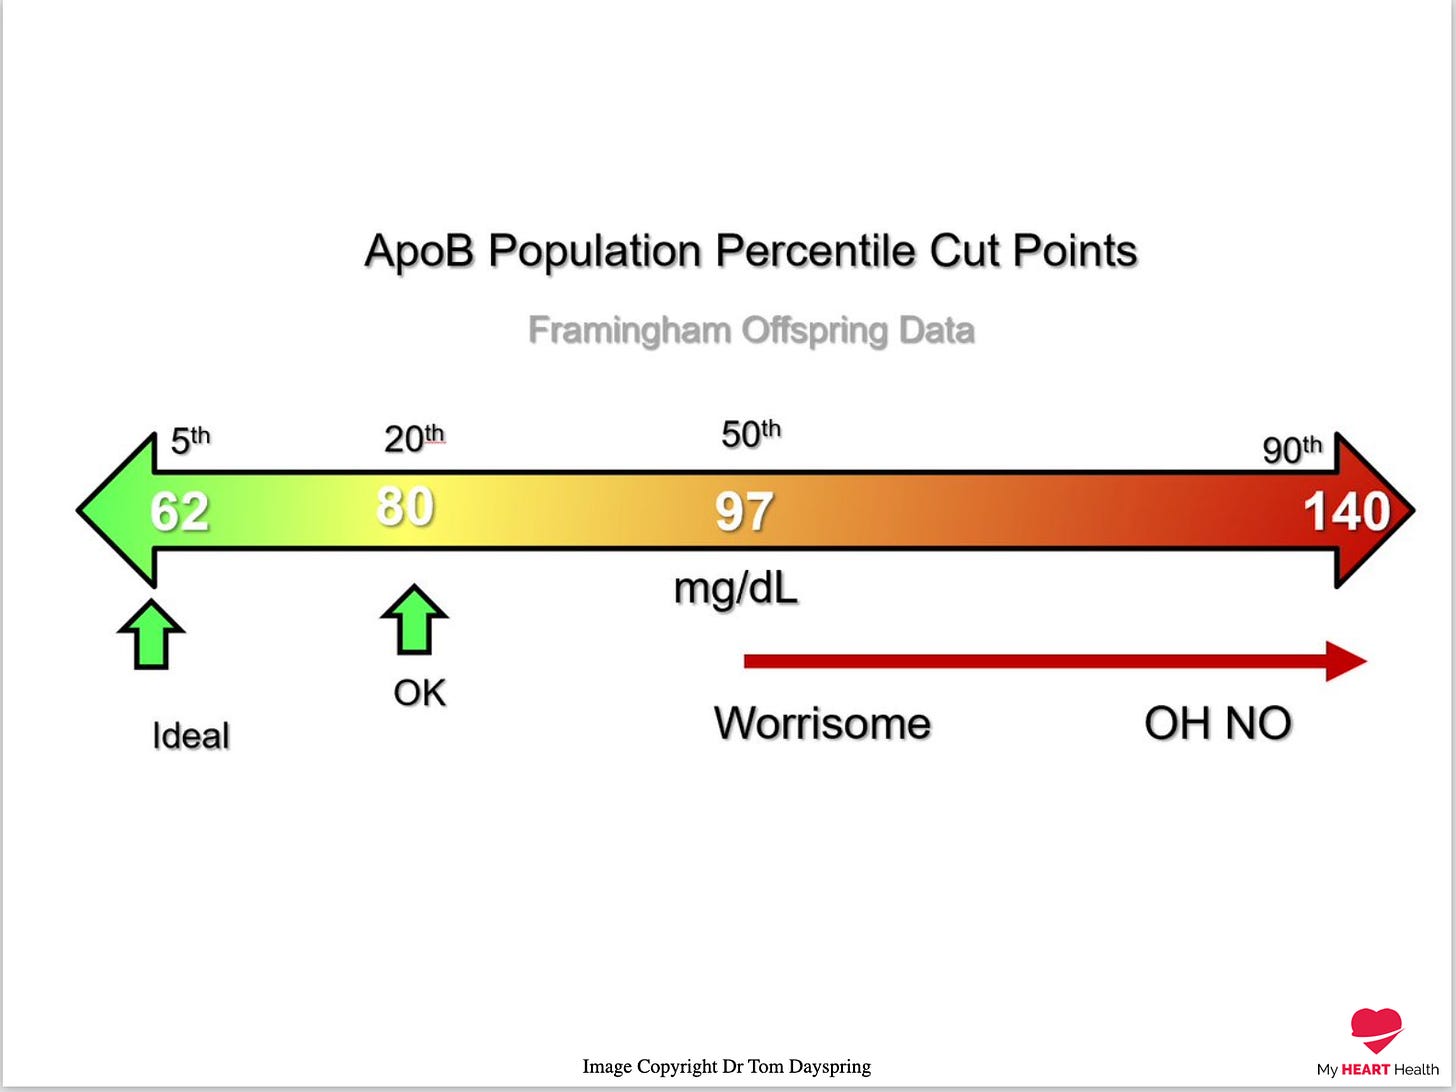
In terms of ranges the following image was created by Dr Thomas Dayspring, a world-class Lipidologist (Who will almost certainly point out technical or terminology errors in this article - We try Tom! ;) )

To finish I would like to tell you a story.
During medical school, one of the classic bedside exam questions we get is how to differentiate the valve issues of aortic stenosis and mitral regurgitation, which produce similar but different murmurs when you listen with a stethoscope.
Hundreds of years of clinical examination have defined the particular characteristics of both these murmurs, and trainee doctors are grilled every year on the differences between the two.
When I teach trainee doctors, I ask them this very question.
“How can you tell the difference between aortic stenosis and mitral regurgitation at the bedside?”
They all come up with a list of the specific characteristics defining each murmur.
I tell all of them that they are wrong.
Regardless of the murmur findings they describe.
Why?
Because using the sounds of a murmur you hear with a stethoscope that was invented in the 1700s is NOT how you make a diagnosis today.
You use an ultrasound. Which can now be used easily at the bedside.
i.e. You DO NOT GUESS!
You measure it DIRECTLY!
The same applies to LDL cholesterol and apoB.
Doctors around the world are routinely only measuring LDL cholesterol and not apoB.
They are the same ones asking about the murmur characteristics of aortic stenosis.
I am not sure it will ever change.
When it comes to something as important as your cardiovascular risk, you should not GUESS.
You should measure the best variable of risk directly.
Which is why you need to measure your apoB.
Mehta, A., Shapiro, M.D. Apolipoproteins in vascular biology and atherosclerotic disease.Nat Rev Cardiol 19, 168–179 (2022). https://doi.org/10.1038/s41569-021-00613-5
Low-density lipoproteins cause atherosclerotic cardiovascular disease. 1. Evidence from genetic, epidemiologic, and clinical studies. A consensus statement from the European Atherosclerosis Society Consensus Panel. Eur Heart J. 2017 Aug 21;38(32):2459-2472.
Low-density lipoproteins cause atherosclerotic cardiovascular disease. 1. Evidence from genetic, epidemiologic, and clinical studies. A consensus statement from the European Atherosclerosis Society Consensus Panel. Eur Heart J. 2017 Aug 21;38(32):2459-2472.
Apolipoprotein B but not LDL cholesterol is associated with coronary artery calcification in type 2 diabetic whites. Diabetes. 2009 Aug;58(8):1887-92.
Prevalence of Optimal Metabolic Health in American Adults: National Health and Nutrition Examination Survey 2009–2016. Metabolic Syndrome and Related Disorders, 2018;
Application of non-HDL cholesterol for population-based cardiovascular risk stratification: results from the Multinational Cardiovascular Risk Consortium. DOI:https://doi.org/10.1016/S0140-6736(19)32519-X
Clinical implications of discordance between low-density lipoprotein cholesterol and particle number. J Clin Lipidol. 2011 Mar-Apr;5(2):105-13.


